A new MSc thesis by Rasmus B. Caspersen and Sean Jellesmark from the University of Copenhagen has summarised 15 years of patrol data collected by Mara Triangle rangers to evaluate spatiotemporal patterns in poaching across the boundary of the Mara-Serengeti Ecosystem (MSE). The analysis revealed considerable seasonal variation and shifts in types of poaching events associated with the timing of the wildlife migration. The spatial analysis found that clustering in poaching hot spots changed over time. These findings indicate that poachers are adapting to increased patrolling and increasingly choosing poaching methods reducing apprehension probability. Overall poaching incidents were much higher on the Tanzanian side of the border than in Kenya.
Background
Two students, Rasmus B. Caspersen and Sean Jellesmark, from the University of Copenhagen, working under WP5 has in September 2018 successfully defended their MSc thesis. Their thesis is based on a rather unique dataset consisting of records made by anti-poaching patrol rangers from the Mara Triangle about arrested poachers, removed snares and trapped and killed animals in the cross-boundary Mara-Serengeti area. The analysis provides an insight into the temporal development and spatial distribution of poaching events over a period from 2001-2017 that can rarely be achieved due to the scarcity of such long time series.
The thesis aimed to collect and extract poaching data from the patrol records, describe the temporal development and the spatial distribution of poaching events and finally to provide recommendations to enhance the cost-efficiency of patrolling. Data were extracted from monthly reports compiled by the Mara Conservancy describing the outcome of patrolling by conservancy rangers in the regions of Lemai Wedge and East Mara River in Tanzania and in the Mara Triangle in Kenya. The dataset spans August 2001 to December 2017 and contains 3805 encounters related to poaching. The analysis operates with four types of encounters: Animal carcasses found, snares recovered, poachers arrested, and poachers observed where no arrests were made. A patrol effort measure (miles patrolled) was created based on monthly vehicle fuelling and used to correct records for catch per unit of effort (CPUE) for analysis of temporal patterns.
Methods
Spatial and temporal statistics were applied to reveal trends in poaching patterns. Time series analysis involved decomposition of the seasonal and longer-term patterns and generating forecasts of likely future developments. The spatial analysis included tests for significant “clusters” and “hot spots” in three intervals: 2001-2007, 2008-2012, and 2013-2017.
Results
Poachers are arrested in most months, whereas snaring was far more seasonal and seems to follow migration patterns of animal abundance, with peak values July-November (Figure 1).

Figure 1. Number of snares recovered/mile and the number of poachers arrested/mile from February 2008 – December 2017 for the overall area.
Poaching pressure was highly regional, and the effect of anti-poaching patrolling seems to differ between regions. The number of poachers arrested/mile has decreased significantly in the Mara Triangle since 2008 while the pattern in the Lemai Wedge is more stable (Figure 2). This finding underpins the importance of regional specific effort against poaching and suggests that drivers of poaching differ even between adjacent areas.
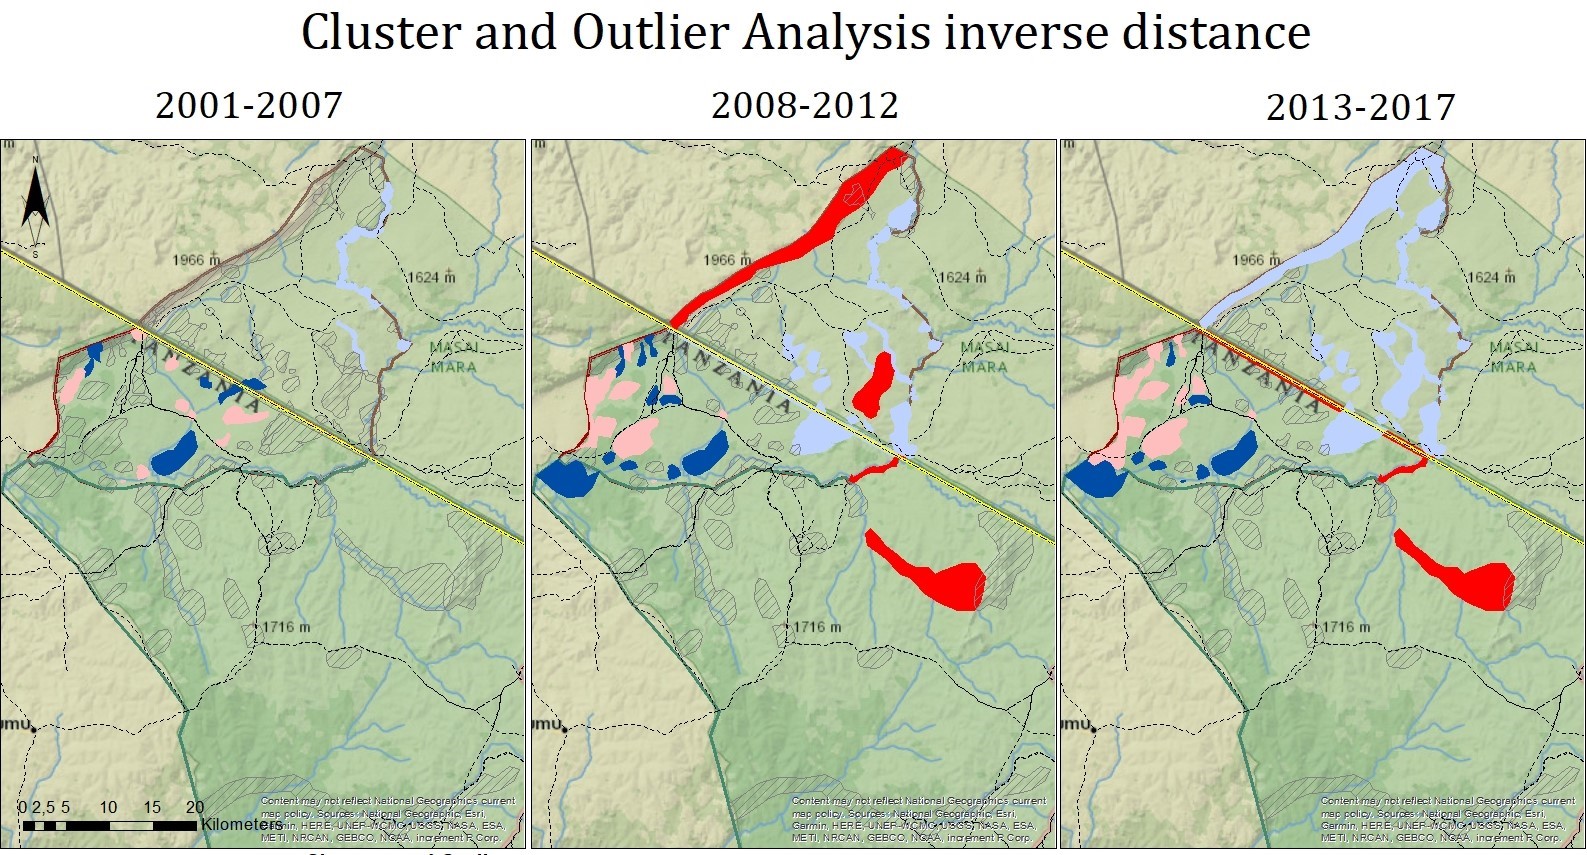
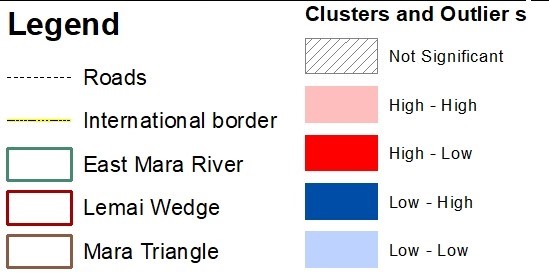
The number of all poaching encounters was used as the sole variable in the spatial analysis because it depicts the overall poaching level by operating on counts rather than sums. The spatial analysis revealed a significant change in the distribution of poaching between periods (Figure 3). Poaching events appeared randomly distributed in 2001-2007. However, in the periods 2008-2012 and 2013-2017 there is significant autocorrelation and observed poaching events are more clustered.
Clusters of high poaching occur around the western boundary of the Lemai Wedge area, while the Mara Triangle in Kenya is characterised by low clusters. High levels of poaching are concentrated in the vicinity of the boundary of the protected area and around permanent water sources like the Bologonja river further within the protected areas.

Figure 3. Spatial distribution of poaching events in the periods 2001-2007, 2008-2012 and 2013-2017.
Based on the results recommendations were provided to the Mara Conservancies about how patrol efficiency can be optimised through careful allocation of patrolling effort across time and space.
Downlad the complete Master’s thesis:
Investigating poaching trends in the Mara-Serengeti Ecosystem, Kenya, Tanzania (PDF)


